Fig. 3.

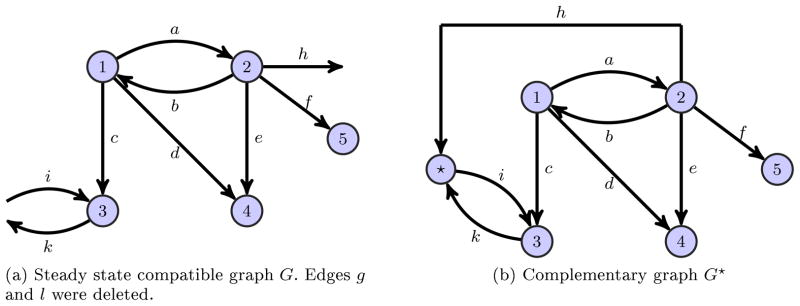
Steady state compatible graph with its corresponding complementary graph. The graph G illustrated in Figure 2a was tested for the conditions of Theorem 5 and conflicting edges were deleted.

Steady state compatible graph with its corresponding complementary graph. The graph G illustrated in Figure 2a was tested for the conditions of Theorem 5 and conflicting edges were deleted.