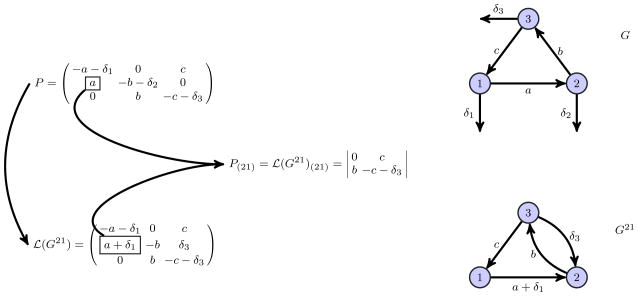
Fig. 4.
2nd row of P is reconstructed to get the Laplacian matrix
 (G21) and the associated strongly connected graph G21. At the top (from left to right), perturbed Laplacian matrix P and the associated graph G. In the middle, (21)-th minor of P and (21)-th minor of
 (G21). At the bottom (from left to right), Laplacian matrix
 (G21) and the associated graph G21.

