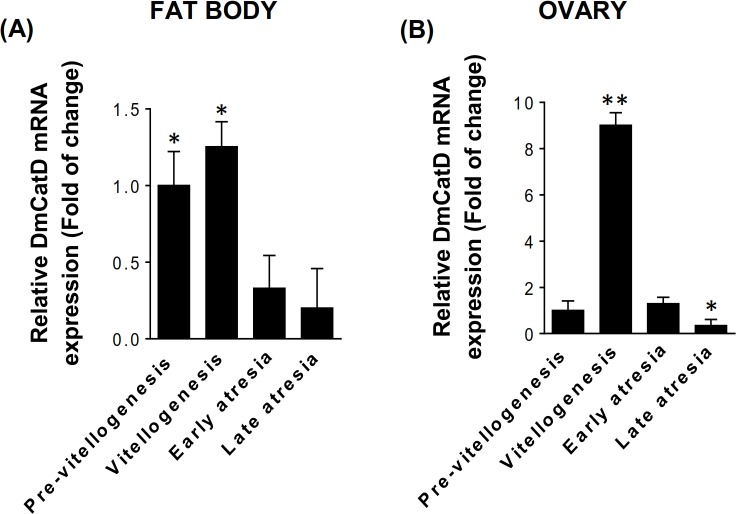
Fig 1. Relative DmCatD mRNA quantification evaluated by RT-qPCR.
Total RNA was extracted from fat bodies (A) and ovaries (B) of females at different stages of the reproductive cycle. Quantification of 18S ribosomal RNA was used as internal control. Results expressed as mean ± SEM indicate the fold of change respect to the mRNA levels at pre-vitellogenesis (n = 3). (A), *P<0.01 vs. early and late atresia. (B), *P<0.05 vs. pre-vitellogenesis and early atresia; **P<0.001 vs. pre-vitellogenesis, early and late atresia.

