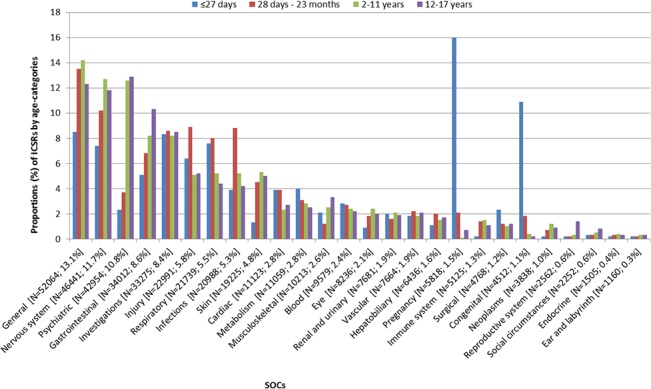
Fig 4. Proportions of reported events by system organ classes.

Distribution of the number of reported events over system organ classes (SOCs), stratified by age-categories. The reported SOCs are presented at the X-axis including the number of reports and the percentage of total. On the y-axis the distribution of the age-categories within each SOC is presented, counting up to 100%. Within the bars the proportion of this SOC within the total number of reported events within the specified age-category is presented.
