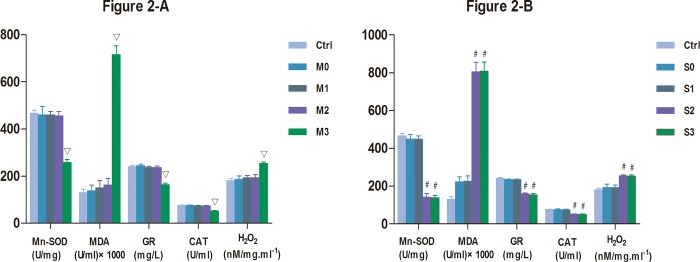
Fig 2. Levels of Mn-SOD, GR, and CAT, MDA and H2O2 in the kidneys perfused at different pressures in rabbits with mild and severe hydronephrosis.

A: Activity of Mn-SOD, GR, CAT, MDA, H2O2 in rabbits with mild hydronephrosis. B: Activity of Mn-SOD, GR, CAT, MDA, H2O2 in rabbits with severe hydronephrosis.▽p<0.05 compared with the M0 group. #p<0.05 compared with the S0 group. Ctrl: normal kidneys perfused with 20 mmHg, 60 mmHg or 100 mmHg. M0, M1, M2, and M3 represent rabbits with mild hydronephrosis subjected to perfusion pressure of 0 mmHg, 20 mmHg, 60 mmHg and 100 mmHg, respectively. S0, S1, S2, S3 represent rabbits with severe hydronephrosis subjected to perfusion pressure of 0 mmHg, 20 mmHg, 60 mmHg and 100 mmHg, respectively.
