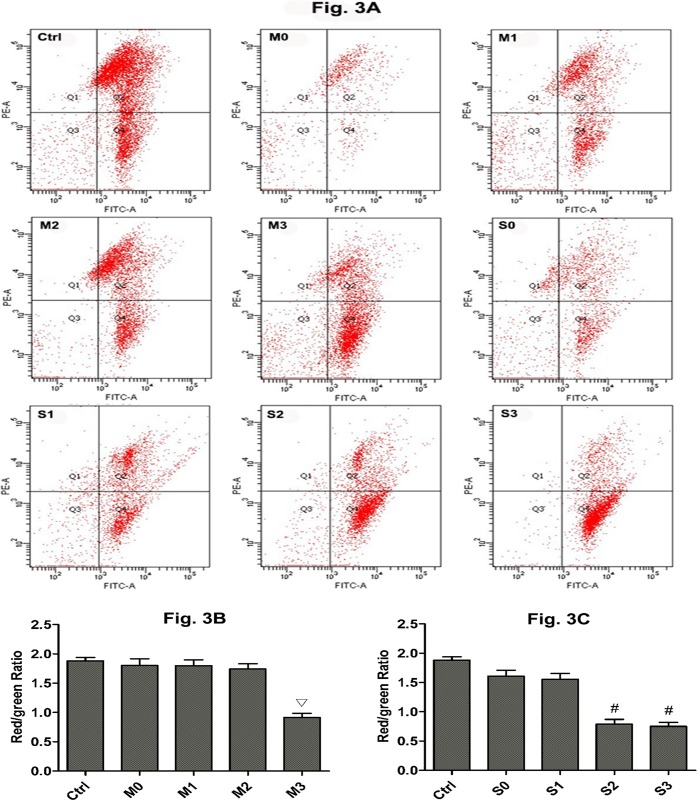
Fig 3. Mitochondrial membrane potential (MMP) of renal cells subjected to different amounts of pressure in mild and severe hydronephrosis.
PE-A Represented red fluorescence, FITC-A represented green fluorescence. MMP values were expressed as the ratio of red fluorescence intensity (Q2) to the green fluorescence intensity (Q4). A: MMP analysis by flow cytometry in rabbits with mild and severe hydronephrosis. B: MMP of renal cells in rabbits with mild hydronephrosis. C: MMP of renal cells in rabbits with severe hydronephrosis. ▽p<0.05 compared with the M0 group. #p<0.05 compared with the S0 group. Ctrl: normal kidneys perfused with 20 mmHg, 60 mmHg and 100 mmHg. M0, M1, M2, and M3 represent rabbits with mild hydronephrosis subjected to perfusion pressure of 0 mmHg, 20 mmHg, 60 mmHg and 100 mmHg, respectively. S0, S1, S2, and S3 represent rabbits with severe hydronephrosis subjected to perfusion pressure of 0 mmHg, 20 mmHg, 60 mmHg and 100 mmHg, respectively.

