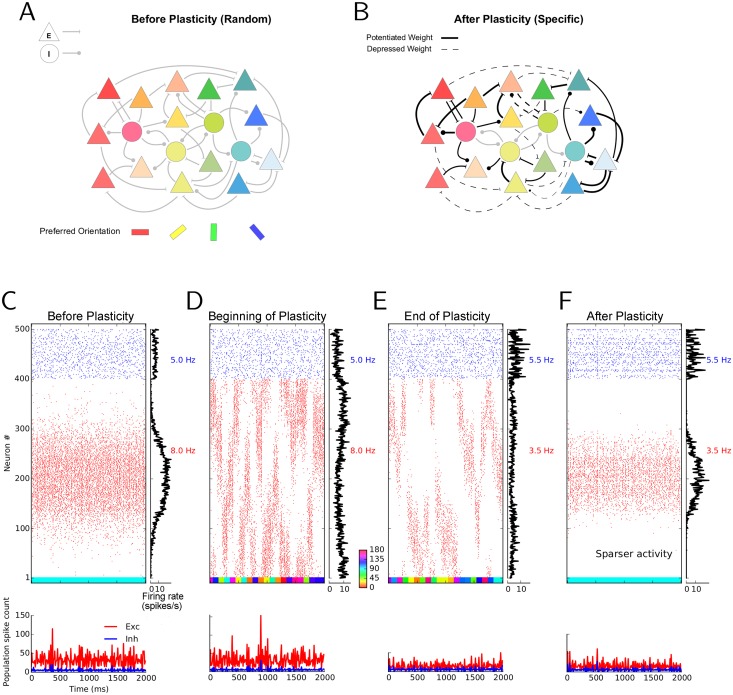
Fig 1. Simulating the effect of synaptic plasticity in balanced random networks.
(A) In random networks of excitatory (E; triangles) and inhibitory (I; circles) neurons, synaptic connections are established disregarding the stimulus selectivities (preferred orientation) of pre- and post-synaptic neurons. (B) In specific networks, synapses between neurons of similar preferred orientations are stronger, while dissimilar feature selectivity of pre- and post-synaptic neurons imply weaker synapses between them. (C–F) Stimulus-induced response of a network before, during and after learning. The middle of each panel shows the raster plot of two seconds of stimulation. Spikes of excitatory and inhibitory neurons are displayed in red and blue, respectively. Within each population, neurons are sorted according to the preferred orientations of their weakly tuned inputs. Average firing rates of individual neurons during the period of stimulation are shown in the histogram on the right. The average firing rate of each subpopulation is indicated to the right of it, in the corresponding color. The lower panel depicts the time-resolved histograms of population activity for excitatory (red) and inhibitory (blue) neurons, respectively. Population spike counts are extracted from bins of size 10 ms. The colored bar at the bottom of the main panel shows the sequence of stimulus orientations applied during the simulation (color code is indicated between panels (D) and (E)). For the simulations before (C) and after (F) learning, the initial or final weights are frozen, respectively, and network activity is simulated with static weights in response to a stimulus of orientation 90°. During learning, a network with plastic synapses is stimulated with 40 batches of oriented bar stimuli. Each batch consists of a random sequence of 20 different stimulus orientations, each stimulus lasting for 100 ms. Therefore, the “visual experience” lasts 20 × 20 × 0.1 s = 40 s in total. The responses to the first and the last batch are shown in (D) and (E), respectively.

