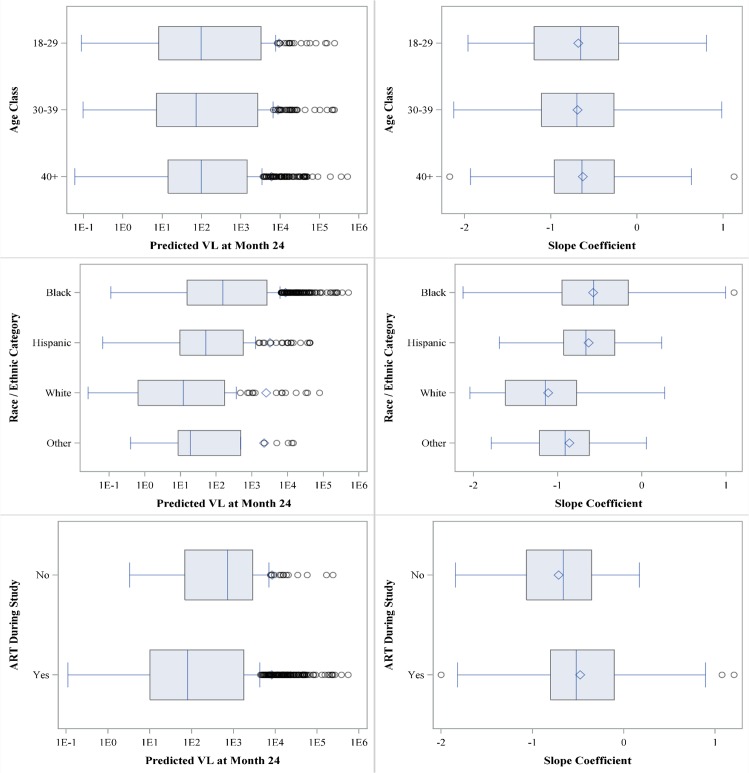
Fig 3. Box plots by characteristic for the participants predicted VLs at month 24 and rate of change (slope).
The shaded box represents the 25th and 75th percentiles, while the vertical line and diamond within the shaded box are the median and mean, respectively. The upper and lower arms, represented by vertical lines, are the 2.5 and 97.5 percentiles, and dots outside these arms are considered outliers.

