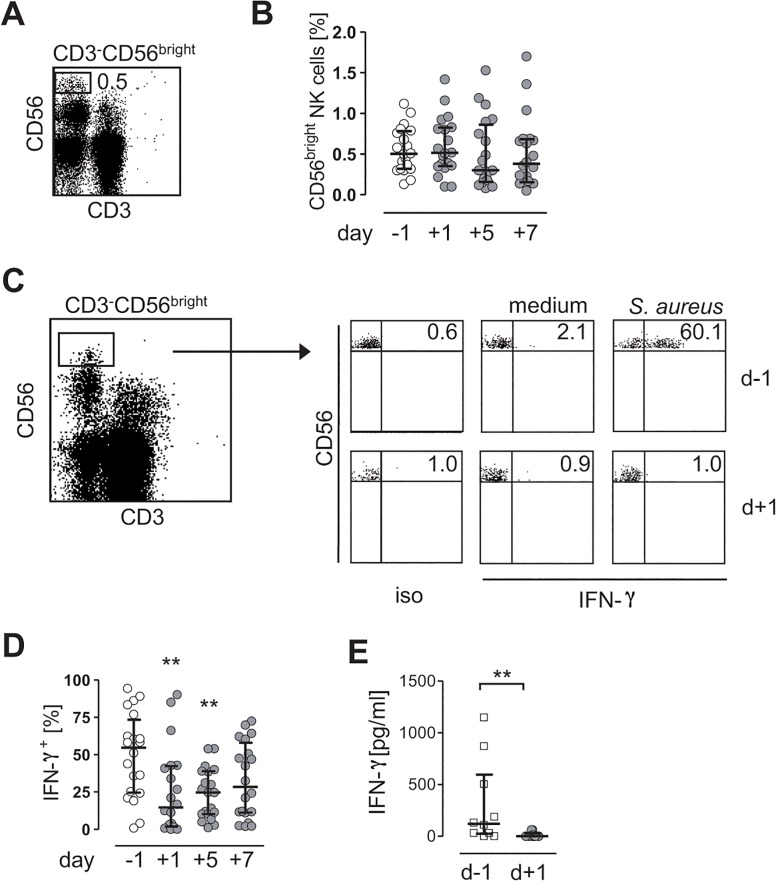
Fig 2. CD56bright NK cells are suppressed in Staphylococcus aureus-induced IFN-γ synthesis after invasive surgery.
(A-D) PBMC were isolated from “patients 1” 24 h before (-1) and 1 d (+1), 5 d (+5), and 7 d (+7) after surgery and were stained against CD3 and CD56. (A) Gating strategy of CD3-CD56bright NK cells among total PBMC. The number indicates the percentage of gated cells in the rectangle. (B) Cumulative data on the percentage of gated CD3-CD56bright NK cells among total PBMC. (C, D) PBMC were cultured in the presence of S. aureus and cells were stained for intracellular IFN-γ. (C) Representative dot plots of intracellular IFN-γ expression in gated CD3-CD5bright NK cells isolated before and 1 d after injury. Numbers indicate the percentage of IFN-γ-positive (IFN-γ+) cells. (D) Cumulative data on the kinetics of IFN-γ+ CD3-CD56bright NK cells upon exposure to S. aureus before and after injuy. (E) CD56bright NK cells were purified from “patients 2” (n = 11) 1 d before and on day +1 after injury and stimulated with IL-12 and IL-18. The release of IFN-γ into the supernatant was quantified. Results are expressed as scatter plots (median, interquartile range). Statistical differences were tested using the Friedman test (B, D) or the Wilcoxon signed rank test (E). *, p<0.05; **, p<0.01; ***, p<0.001 vs. d-1. iso, isotype control antibodies.

