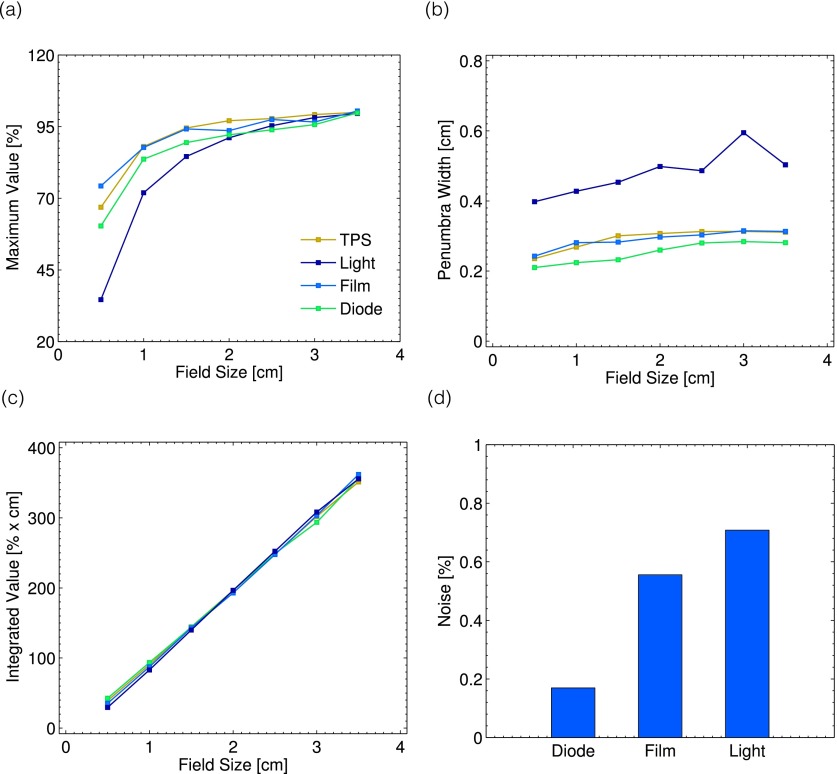
FIG. 11.
The metrics obtained from the 1D profiles are shown. In (a), the maximum value for each of the seven field sizes is plotted for all measurement techniques. The corresponding penumbra for each method as a function of field size is plotted in (b). In (c) and (d), the integrated area under the curve for each field size and measurement noise are shown.

