Fig. 2.
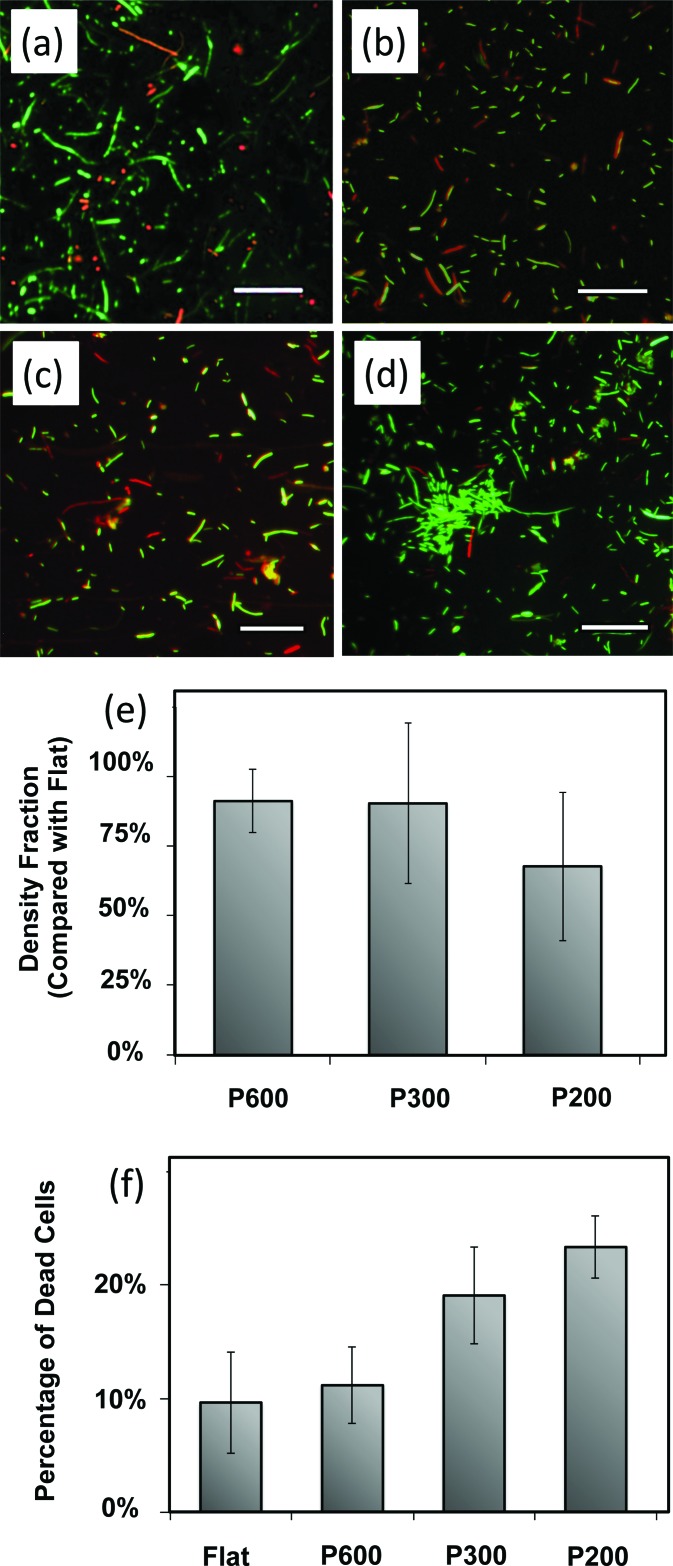
Live-dead assay micrographs are representative micrographs on (a) P600, (b) P300, (c) P200, and (d) the flat control. Live cells are tagged with green fluorescent SYTO9 while dead cells are tagged with red fluorescent propidium iodide. Scale bars = 30 μm. (e) There is a decreased cell density on pillared surfaces compared to control flat surfaces, more so on smaller, more closely spaced pillars. Error bars represent the standard deviation of all samples. (f) The percent of cells on the surface that are dead is greater on pillars than on the flat controls. Additionally, the percent of dead cells is higher on smaller, more closely spaced pillared surfaces. Error bars represent the standard deviation of all samples.

