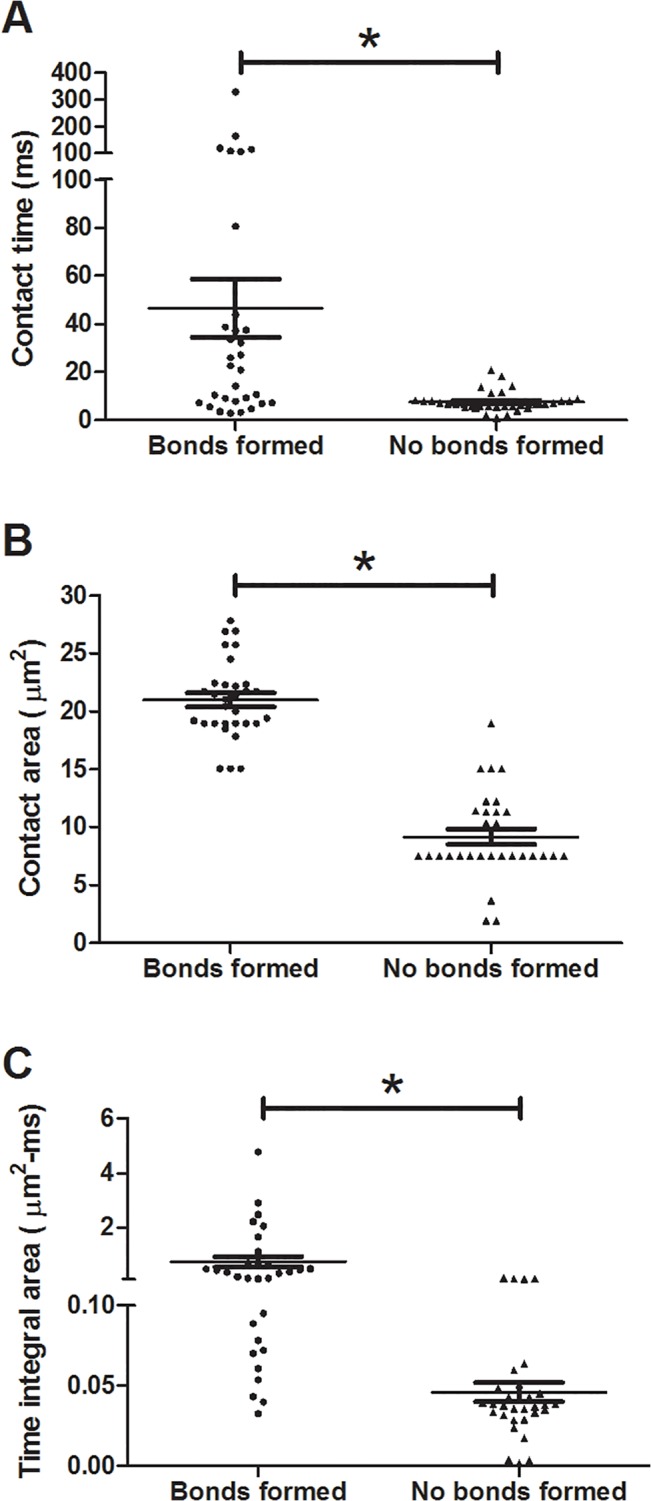
Fig 8. Contact time and contact area for collisions where bonds did and did not occur.

Contact time (A), contact area (B), and time integral contact area (C) graphs for collisions where no bonds formed and where adhesion events occurred. *p<0.01.

Contact time (A), contact area (B), and time integral contact area (C) graphs for collisions where no bonds formed and where adhesion events occurred. *p<0.01.