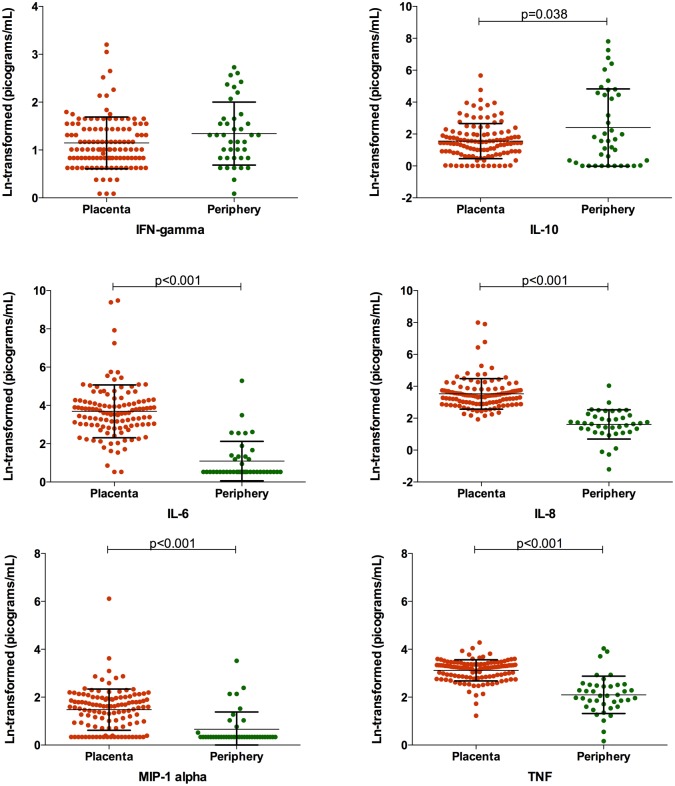
Fig 2. Placental and peripheral blood cytokine levels.
Placental (orange, n = 118) and peripheral (green, n = 40) levels of cytokines measured in this study. All levels are ln-transformed in picograms/mL. Bars represent the mean and standard deviation. Student’s t-tests with Welch correction were performed to evaluate differences between the two compartments.

