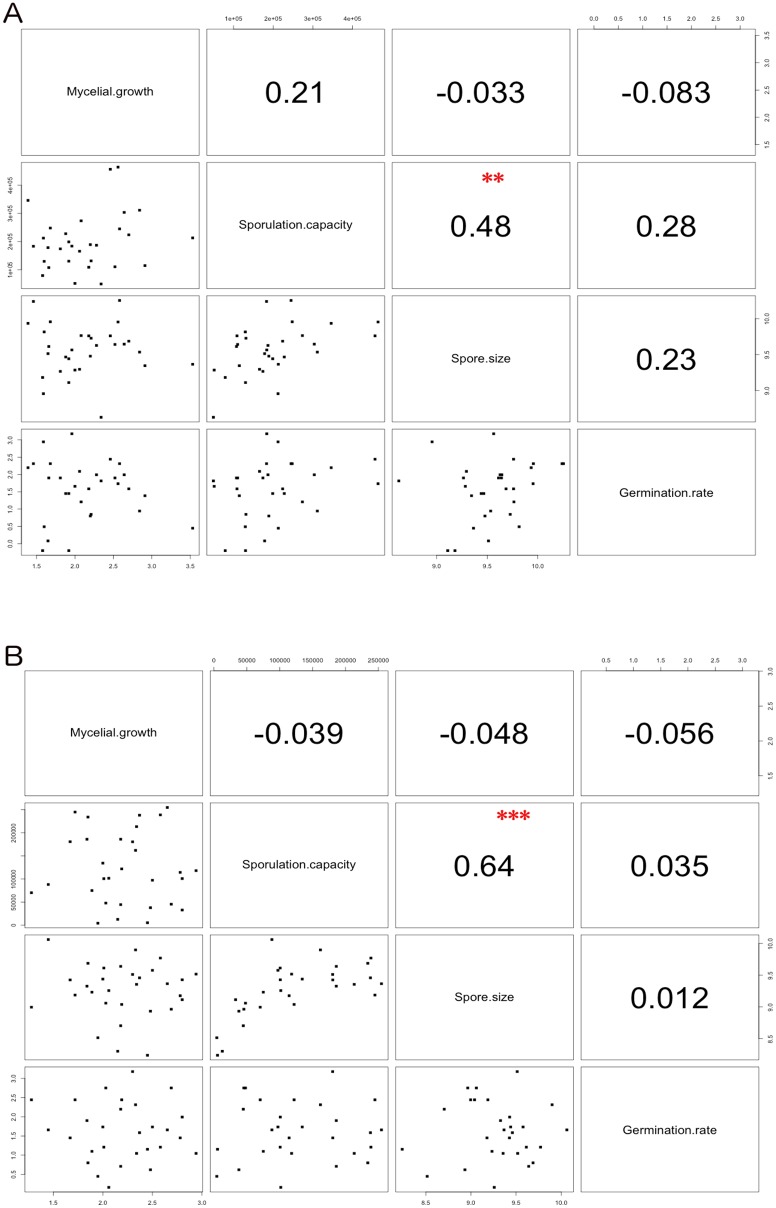
Fig 2. Pairwise correlations between phenotypic traits.
Scatter plots indicating the degree of correlation between traits (below diagonal) and pairwise Pearson's correlation R values (above diagonal). Pearson’s correlation coefficients were calculated from averaged data from each strain for sporulation capacity, spore size and hyphal growth. Statistical significant correlation coefficients are indicated as following: ** P-value < 0.01 and *** P-value < 0.001. Calculations were performed for domestic (A panel) and wild (B panel) populations, respectively.

