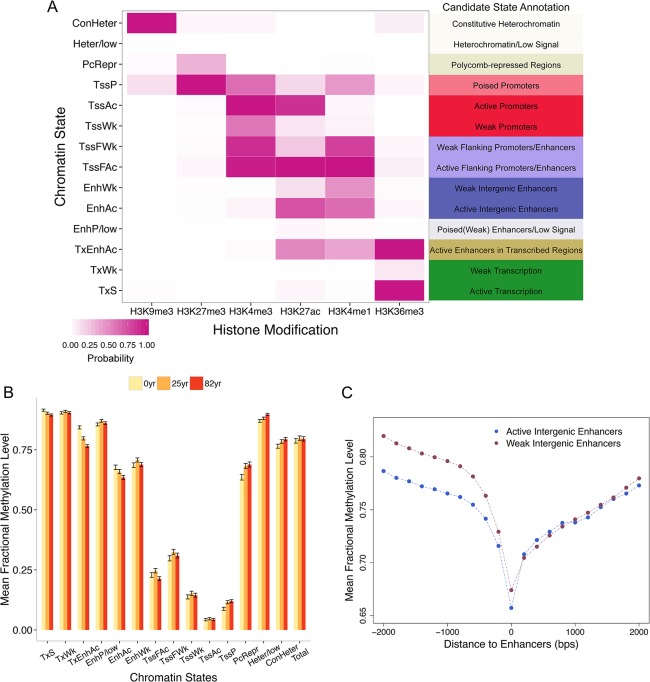
Fig 2. Chromatin states and DNA methylation in brain data.
(A) The emission probability matrix indicating the composition of 6 histone modifications in each state. Candidate annotation for each chromatin state is also presented. (B) DNA methylation levels of CpGs located in different chromatin states. Data (mean fractional methylation levels ± standard error) from three individuals (a newborn as well as a 25-year-old and 82-year-old individual) are presented. In total, 1,000 CpGs were randomly chosen for each state. (C) Enhancers residing in distal intergenic regions (states EnhWk and EnhAc) are significantly hypo-methylated compared with nearby regions. The position 0 indicates the focal enhancer, and the levels of DNA methylation up to 2 kb from the enhancers in either direction are presented (200-bp bin size).

