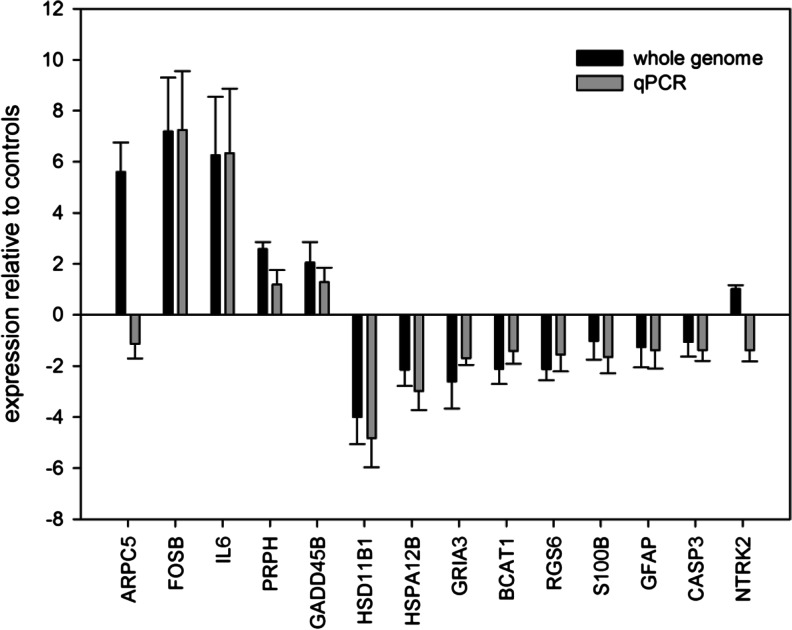
Fig. 1.
Expression of 14 differentially expressed genes (ARPC5, BCAT, CASP3, FOSB, GFAP, GADD45B, GRIA3, HSD11B1, HSPA12B, IL6, NTRK2, PRPH, RGS6, and S100B) in the cerebellum following a frontal cortex injury. bar refer to the mean values and error bar indicate the standard deviation of gene expression. Data are represented as fold change in gene expression relative to the controls

