Fig. 1.

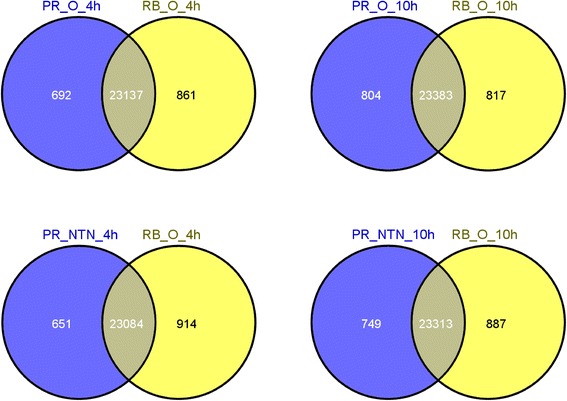
Venn diagrams showing the overlap of expressed genes between the two hosts at different time points (4 and 10 hpi) and inoculated with two different PVY strains, O and NTN

Venn diagrams showing the overlap of expressed genes between the two hosts at different time points (4 and 10 hpi) and inoculated with two different PVY strains, O and NTN