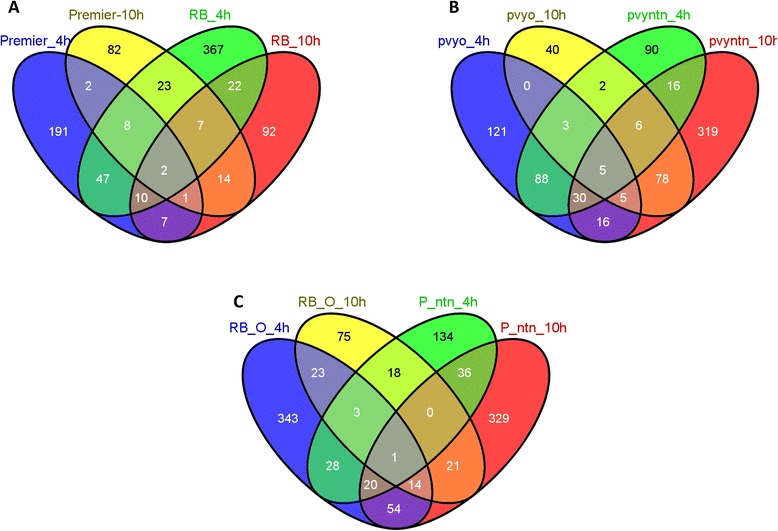
Fig. 3.

Venn diagrams showing the numbers of common and specific DE genes at different time points after PVY inoculation. a, Comparison between DE genes in Premier Russet and Russet Burbank (RB) 4 and 10 hpi with PVYO. b, Comparison between DE genes in Premier Russet 4 and 10 hpi with either PVYO or PVYNTN. c, Comparison between DE genes in Russet Burbank and Premier Russet (P) 4 and 10 hpi with PVYO or PVYNTN, respectively
