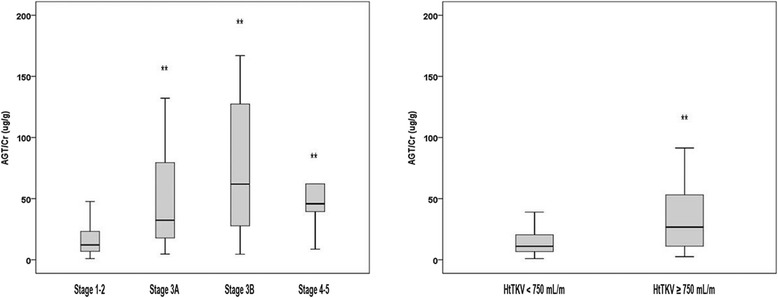
Fig. 2.

Urinary AGT/Cr According to CKD Stages and htTKV. The urinary AGT/Cr value was significantly increased as CKD stages progressed (CKD stage 1-2 (n = 186), 27.8 ± 58.5 μg/g; CKD stage 3A (n = 22), 56.0 ± 61.1 μg/g; CKD stage 3B (n = 15), 89.0 ± 89.5 μg/g; CKD stage 4-5 (n = 9), 95.3 ± 108.9 μg/g). In addition, the subjects with larger htTKV (≥750 mL/m) demonstrated greater urinary AGT/Cr level (50.9 ± 76.7 vs. 23.5 ± 48.2 μg/g, P = 0.003). ** Each value showed statistically significant difference (P < 0.05) compared to the reference value (CKD stage I-II, HtTKV < 750 mL/m). AGT, angiotensinogen; CKD, chronic kidney disease; Cr, creatinine; htTKV, height-adjusted total kidney volume
