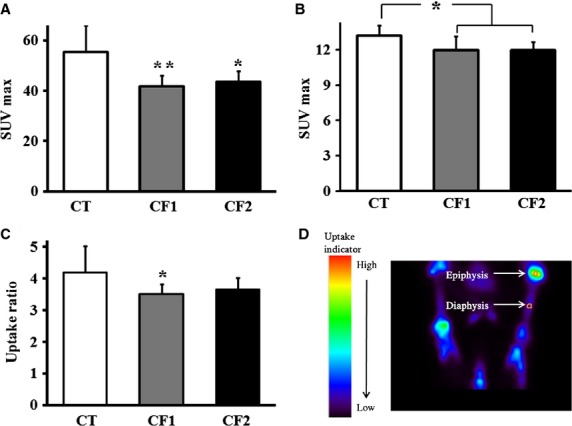
Figure 2.

Comparison of maximum standardized 18F-NaF uptake value (SUVmax) in both tibiae in the control and caffeine-fed groups. SUVmax was measured (a) from epiphyseal GP, and (b) from the diaphysis. (c) Comparison of the ratios of 18F-NaF SUVs in the epiphyseal GP relative to the diaphysis. (d) Representative PET image showing how the ROIs in the epiphysis and diaphysis were defined. CT, control; CF1, caffeine 120 mg kg−1 day−1; CF2, caffeine 180 mg kg−1 day−1.Values are expressed as mean ± SD. *P < 0.05, **P < 0.01 vs. CT.
