
Figure 4.
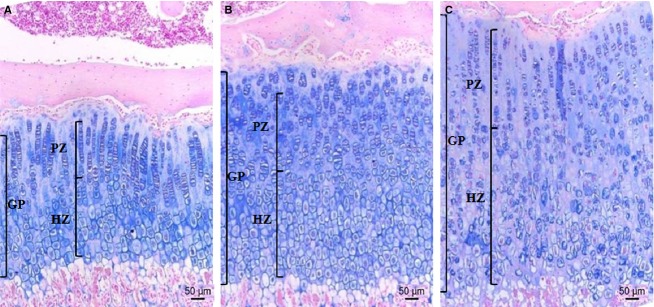
Representative proximal tibia sections from the control and caffeine-fed groups. The tissues were stained with alcian blue; collagen is blue. The GP of (A) the control, (B) CF1 and (C) CF2. The heights of the total GP, PZ and HZ are indicated. GP, growth plate; HZ, hypertrophic zone; PZ, proliferative zone. CT, control; CF1, caffeine 120 mg kg−1 day−1; CF2, caffeine 180 mg kg−1 day−1. Scale bar: 50 μm.