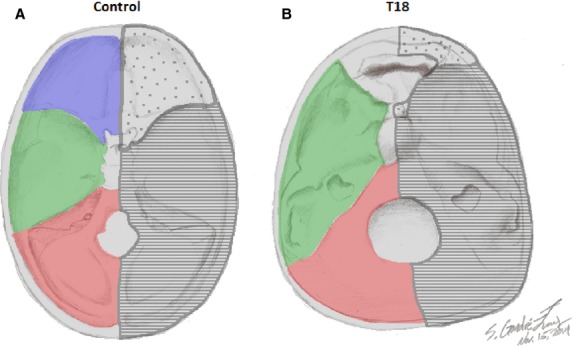
Figure 9.

Schematic reconstruction of the boundaries of cranial fossae and developmental cellular origins. Schema of anterior (blue), middle (green) and posterior (red) cranial fossae and their cell origins (neural crest cells, dotted; occipital sclerotomes, striped) defined in proximity to the center of the sella turcica in the control (A) vs. T18 (B).
