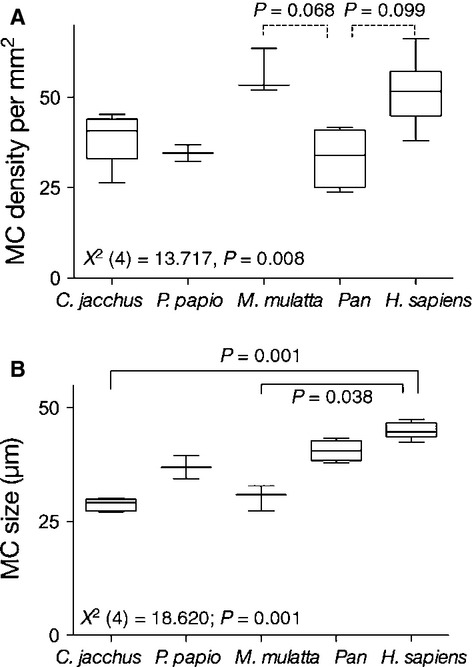
Figure 4.

Comparison of Meissner's corpuscles (MCs) density (A) and size (B) among the primate species. Box-plots indicate the 25th percentile, the median and the 75th percentile; the whiskers indicate the range. Non-parametric Kruskall–Wallis one-way anova showed significant species differences in both the density and the size of MCs. Bonferroni-adjusted post hoc pairwise comparisons revealed significant differences between the species (solid line) or differences that approached statistical significance (dotted lines).
