
Figure 5.
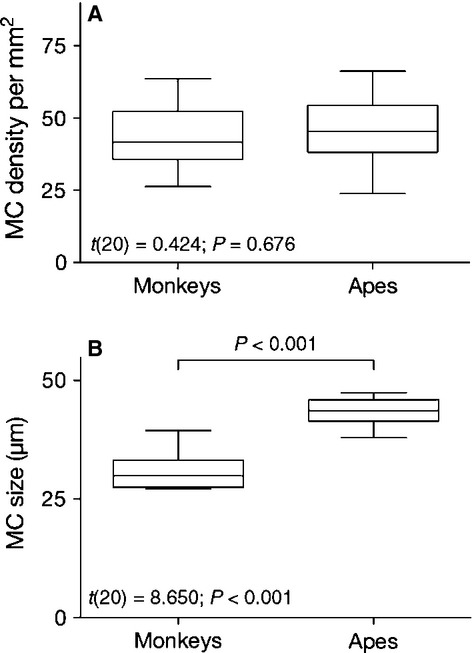
Comparison of Meissner's corpuscles (MCs) density (A) and size (B) between apes (humans and two chimpanzee species) and monkeys (marmosets, baboons and rhesus). Box-plots indicate the 25th percentile, the median and the 75th percentile; the whiskers indicate the range. Independent samples t-test revealed a significant difference between these groups in MCs size but not density.