Figure 4.
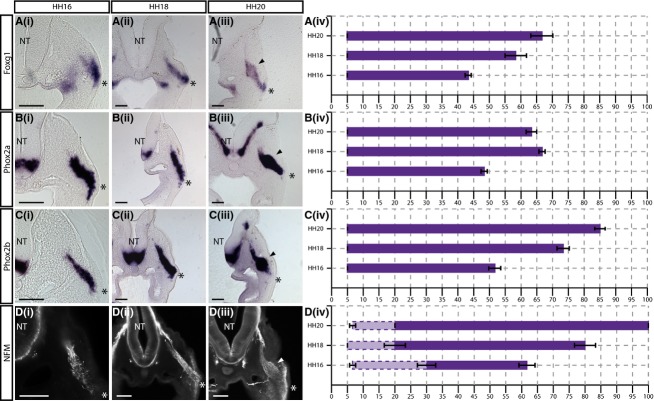
Foxg1, Phox2a, Phox2b and NFM expression begins more basally within the placodal ectoderm. (i–iii)In situ hybridisation showing (A)Foxg1, (B)Phox2a and (C)Phox2b, and immunostaining showing (D) NFM expression in transverse sections at the level of the petrosal ganglion at (i) HH16, (ii) HH18 and (iii) HH20. Arrowheads indicate ganglionic anlage. (iv) Graphical representations of expression patterns where thex-axis = distance from placode to neural tube (NT) as a percentage. NFM staining appears fragmented in regions close to the placode (lighter purple, dotted lines), while further from the placode, NFM staining appears filamentous, labelling cells and neuronal processes as they extend towards the NT (purple, solid lines).N = 3 for each stage. Error bars = SEM. Scale bars: 100 μm. The asterisk indicates the placodal epithelium.

