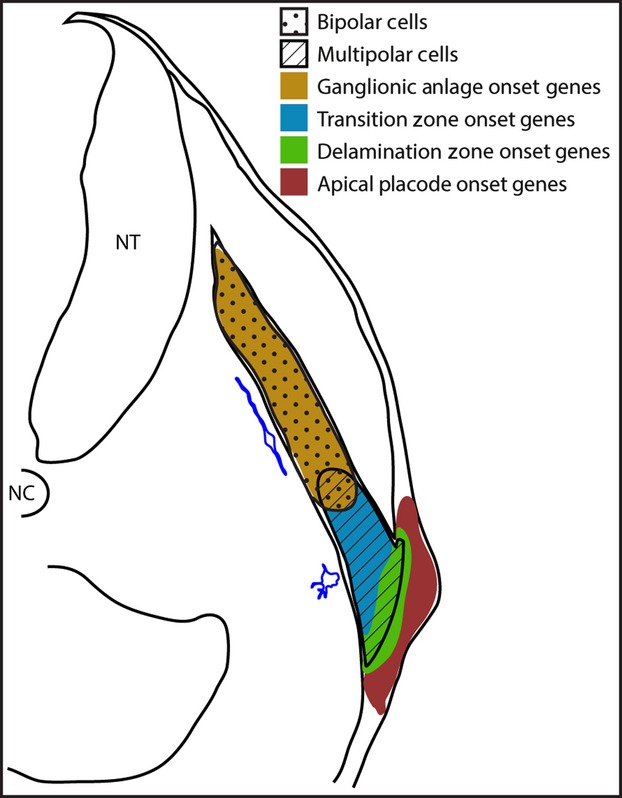
Figure 9.

Representative schematic of the developing petrosal ganglion at HH18. The relative points of gene expression for each of the four groups are shown by the coloured regions. The regions occupied by the multipolar and bipolar cells are shown by hatchings and stipples, respectively. A representative tracing of each morphology type is shown in blue, alongside the region in which they are found. NC, notochord; NT, neural tube.
