Figure 3.

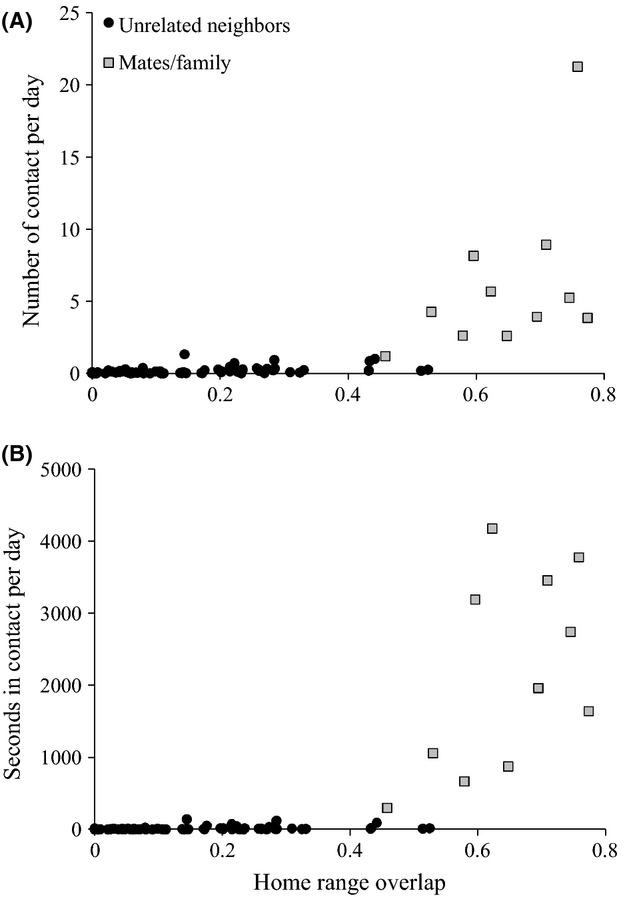
Comparisons of the proportion of home range overlap with the number of contacts per day (A) and seconds in contacts per day (B) between each unrelated fox dyad (circles) and mated pairs or family dyads (squares).

Comparisons of the proportion of home range overlap with the number of contacts per day (A) and seconds in contacts per day (B) between each unrelated fox dyad (circles) and mated pairs or family dyads (squares).