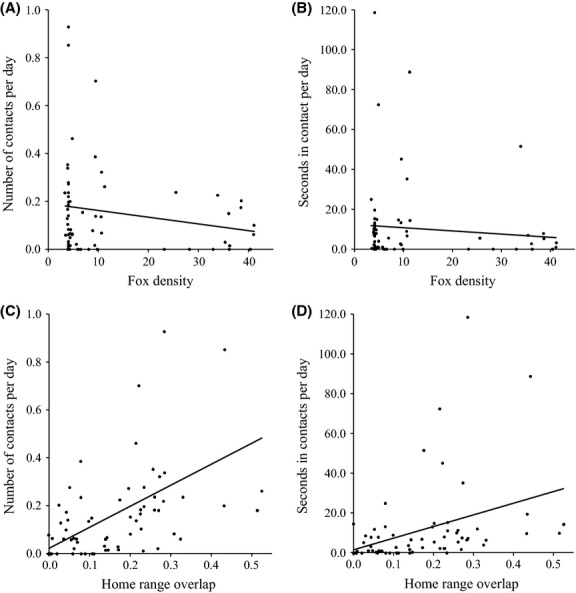
Figure 6.

Comparisons of San Clemente Island fox density with the number of contacts per day between each unrelated fox dyad (A; square-root transformed, R2 = 0.012, P = 0.976), and seconds in contacts per day between each unrelated fox dyad (B; square-root transformed, R2 = 0.003, P = 0.998). Comparisons of the proportion of home range overlap with the number of contacts per day between each unrelated fox dyad (C; square-root transformed, R2 = 0.341, P = 0.008), and seconds in contacts per day between each unrelated fox dyad (D; square-root transformed, R2 = 0.229, P = 0.014).
