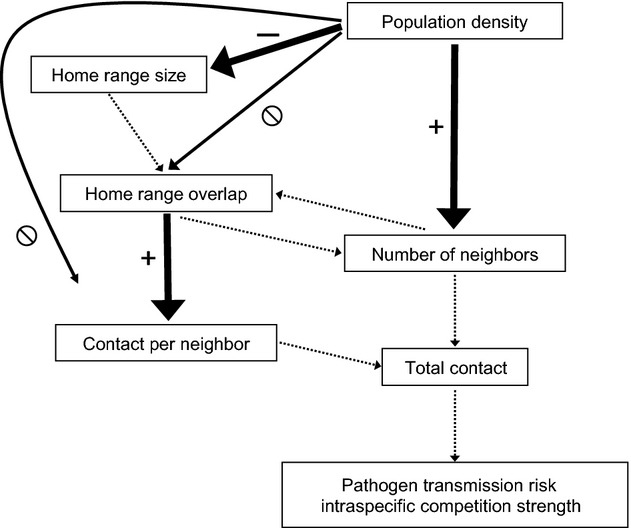
Figure 7.

Pathways through which increases in density influence contact rates, as determined by this study. Thick solid lines indicate hypothesized pathways supported in this study. Thin solid lines indicate hypothesized pathways not supported in this study. Dashed lines indicate pathways not directly addressed in this study.
