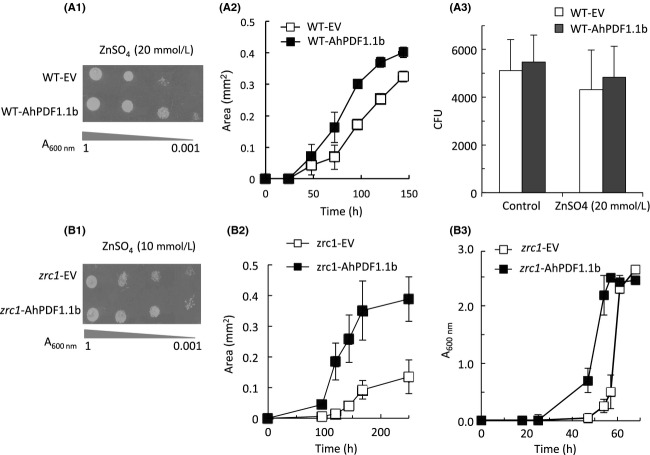
Figure 4.
Zn tolerance phenotypes of wild-type yeast expressing AhPDF1.1b (A) or zrc1 mutant expressing AhPDF1.1b (B). (A.1) Drop-test assays of wild-type yeast expressing the pYX212 empty vector (WT-EV) or wild-type yeast expressing AhPDF1.1b (WT-AhPDF1.1b) on 20 mmol/L ZnSO4 agar plates. An overnight yeast culture was diluted to the A600nm levels indicated and 10 μL were spotted on YNB medium supplemented or not with 20 mmol/L ZnSO4. (A.2) Growth curves of wild-type yeast expressing the pYX212 empty vector (WT-EV) or wild-type yeast expressing AhPDF1.1b (WT-AhPDF1.1b) plated on agar medium supplemented with 20 mmol/L ZnSO4. Isolated colonies plated on 20 mmol/L ZnSO4 were photographed with a SZX16 Olympus stereozoom microscope and their areas were measured using ImageJ software. Error bars correspond to standard errors, n ≥ 50. (A.3) Number of isolated colonies (CFU) of wild-type yeast expressing the pYX212 empty vector (WT-EV) or wild-type yeast expressing AhPDF1.1b (WT-AhPDF1.1b) plated on agar medium supplemented with 20 mmol/L ZnSO4. The number of colonies was counted after plating 100 μL of a A600nm = 0.01 culture of yeast cells. The Student's t-tests give a P = 0.47 on the control medium and a P = 0.27 on the zinc-supplemented medium. Drop-test assays of zrc1 yeast expressing the empty vector (zrc1-EV) or zrc1 yeast expressing AhPDF1.1b (zrc1-AhPDF1.1b) on 10 mmol/L ZnSO4 agar plates. An overnight yeast culture was diluted to the A600nm levels indicated and 10 μL were spotted on YNB medium supplemented or not with 10 mmol/L ZnSO4. B.2 Growth curves of zrc1 yeast expressing the empty vector (zrc1-EV) or zrc1 yeast expressing AhPDF1.1b (zrc1-AhPDF1.1b) obtained by measuring the areas of isolated colonies plated on 10 mmol/L ZnSO4. Error bars correspond to standard errors, n ≥ 50. B.3 “Zinc shock” assay in liquid culture of zrc1 yeast expressing the empty vector (zrc1-EV) or zrc1 yeast expressing AhPDF1.1b (zrc1-AhPDF1.1b). The growth curves are followed by A600nm measurements during a zinc shock assay as described in [27]. Error bars correspond to standard errors, n = 3.

