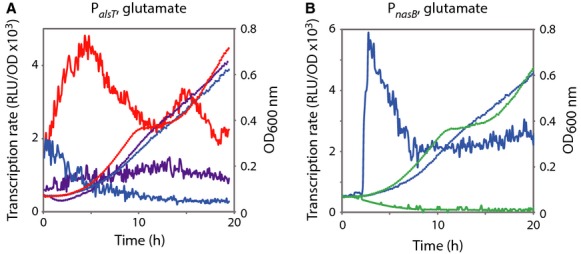
Figure 1.

Expression of alsT and nasB under the control of TnrA. Strains were grown in minimal medium supplemented with glutamate as the sole nitrogen source. Growth was monitored by measuring the optical density at 600 nm in parallel with light emission: blue circles, wild type; red circles, ΔtnrA; purple circles, tnrA::tnrA-spa. (A) Promoter activity of PalsT′-luc in wild-type (blue line), ΔtnrA (red line), and tnrA::tnrA-spa (purple line) cells. (B) Promoter activity of PnasB′-luc in wild type (blue line) and ΔtnrA (green line) cells. For each strain, one representative curve, out of three independent replicates realized, is shown.
