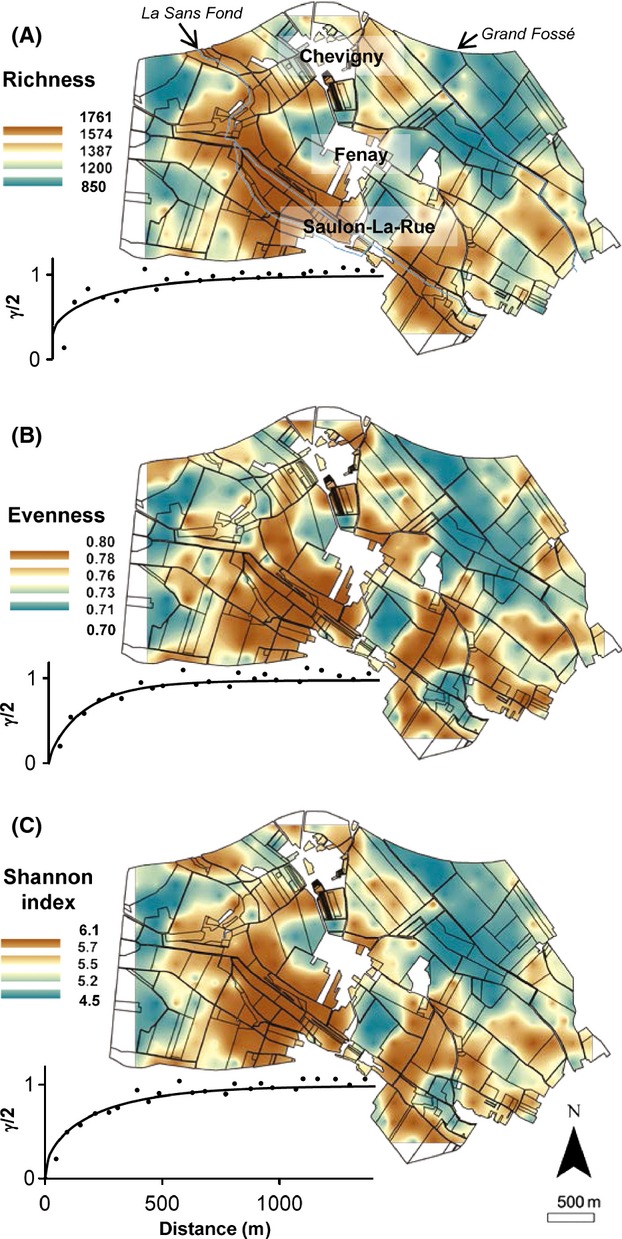
Figure 3.

Maps of (A) bacterial richness, (B) bacterial evenness, and (C) bacterial Shannon index parameters measured on the scale of the Fenay landscape. The color indicates the extrapolated values. Points represent the experimental variogram, and continuous lines the Matérn models fitted by maximum likelihood method. Geostatistics and cross-validation parameters are provided in Table S2.
