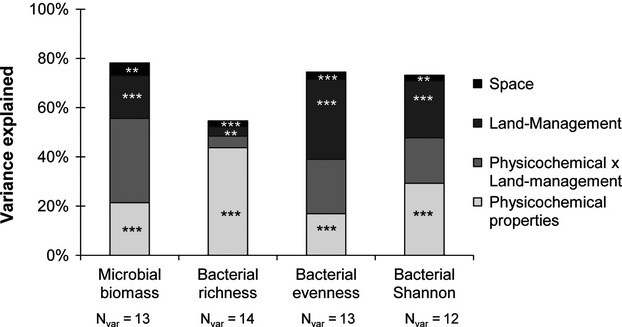
Figure 4.

Variance partitioning of molecular microbial biomass and bacterial diversity parameters. The amount of explained variance corresponds to the adjusted r2 values of the contextual groups using partial redundancy analysis:  soil physicochemical characteristics;
  land management
  space;
  shared amount of variance between soil characteristics and land management that could not be tested. The significance level of the contribution of the sets of variables is indicated as follows **P < 0.01 and ***P < 0.001. NVar is the number of explanatory variables retained after selecting the most parsimonious explanatory variables (by minimizing the AIC, akaike information criterion).
