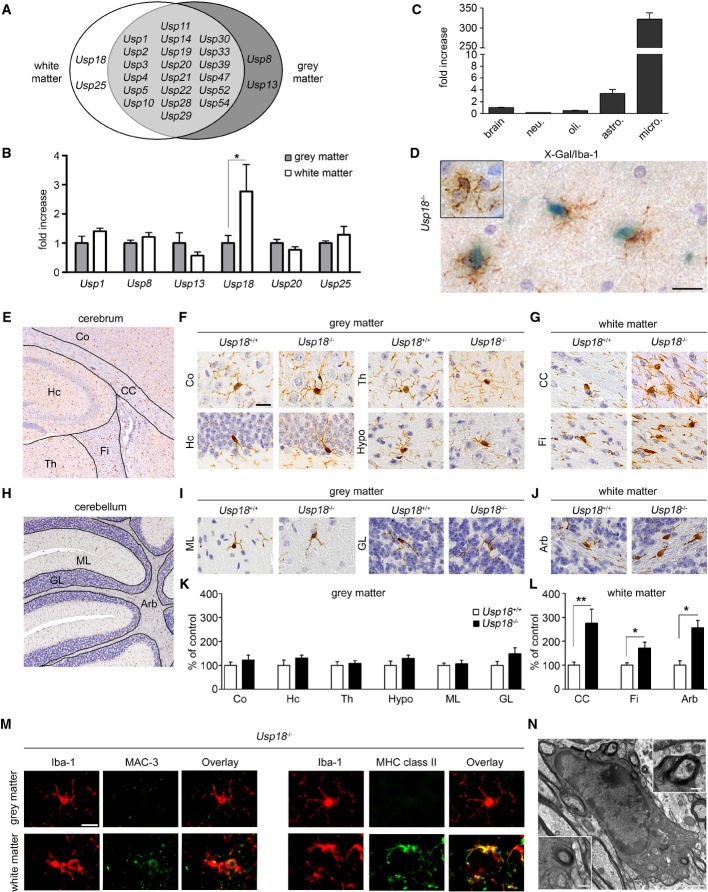
Figure 1. Usp18 is a distinct feature of white matter microglia and essentially regulates microglia quiescence.
A Spatial distribution of ubiquitin-specific protease (USP) transcripts based on FACS-sorted adult microglia isolated from the white or gray matter that were subsequently examined by MouseRef-8 v2.0 Expression Bead Chip (Illumina) array analysis (Olah et al, 2012). Each USP shown exceeds a median expression value of two resulting from five mice compared to the mean expression value of the same gene in the other brain region.
B Quantitative RT–PCR of indicated genes in FACS-isolated adult microglia. Bars represent means ± s.e.m. with three mice in each group (*P < 0.05). Significant differences are determined by an unpaired t-test.
C Expression of Usp18mRNA measured by qRT–PCR in primary microglia (micro.), astrocytes (astro.), neurons (neu.) and oligodendrocytes (oli.). Bars represent means ± s.e.m with at least three samples in each group normalized to the mean expression value of Usp18 transcripts in the whole brain.
D Cell-specific expression of Usp18. Light microscopic analysis of X-gal-stained (blue) white matter brain tissue of adult Usp18LacZ/LacZ mice. Iba-1 staining (brown) reveals microglia. Inserts show microglia from the cortex. Scale bar, 20 μm.
E–G Histology of different brain areas in the cerebrum of adult Usp18+/+ and Usp18LacZ/LacZ (Usp18−/−) mice. Cortex (Co), hippocampus (Hc), thalamus (Th) and hypothalamus (Hypo) represent areas of the gray matter, whereas corpus callosum (CC) and fimbria (Fi) are defined as white matter. Scale bar, 10 μm.
H–J Histological pictures of different cerebellar regions of adult Usp18+/+ and Usp18LacZ/LacZ (Usp18−/−) mice. Molecular layer (ML) and granular layer (GL) represent areas of the gray matter, whereas arbor vitae (Arb) is part of the white matter.
K, L Quantification of Iba-1+ microglia in the different areas of Usp18LacZ/LacZ (Usp18−/−) mice. Microglia numbers are normalized to that found in Usp18+/+ littermates and are displayed as % of control. At least five mice per genotype were counted. Significant differences are determined by an unpaired t-test or Mann–Whitney U-test and marked with asterisks (*P < 0.05, **P < 0.01). Bars represent means ± s.e.m.
M Immunofluorescence of white matter and gray matter microglia (Iba-1, red) in adult Usp18−/− animals (green, scale bar, 10 μm). Three animals per genotype were examined. One characteristic picture is shown.
N Transmission electron microscopy of myelin-phagocytosing microglia in adult Usp18LacZ/LacZ (Usp18−/−) mice. Scale bars, 1 μm (overview) and 250 nm (zoom).

