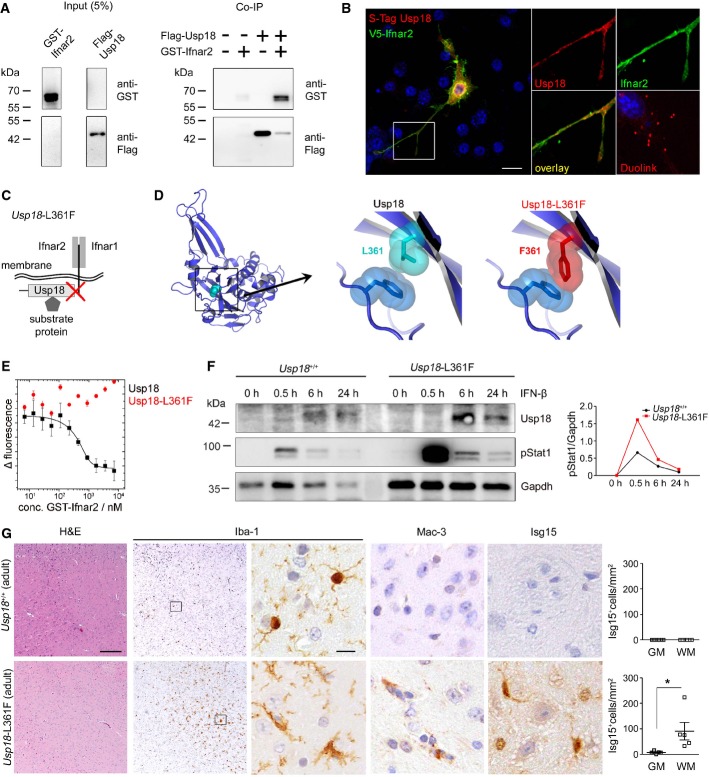
Figure 6. WMMA is regulated by interaction of Usp18 with the Ifnar2 domain.
A Co-immunoprecipitation (Co-IP) of flag-tagged Usp18 with the GST-Ifnar2 subunit upon overexpression in HEK293T cells. FLAG-Usp18 was precipitated using anti-FLAG beads, and Ifnar2 was detected by anti-GST immunoblotting revealing direct interaction of Ifnar2 with USsp18. Input is shown as transfection control.
B Proximity ligation assay for the co-localization of Usp18 with Inar2 in the microglial cell line BV-2. S-tagged Usp18 (red) associates with V5-tagged Ifnar2 (green). Close proximity of both proteins is shown by fluorescence dots (red) using a Duolink® probe. Scale bar, 10 μm.
C Scheme of Usp18 interactions with either cytoplasmatic substrate/interacting proteins or trans-membrane anchored type I interferon receptor (Ifnar) and its subunits 1 and 2. The red cross designates the genetically inactivated motif in Usp18-L361F mutant animals.
D Molecular model of Usp18 wild-type and Usp18-L361F variant. The replacement of Leu at position 361 by Phe results in a sterical clash with Phe271 and might disturb the conformation of the surface loop comprising residues 268–275.
E Binding analysis of USP18 and USP18-L361F with the intracellular domain of Ifnar2 by microscale thermophoresis. USP18 binds with high affinity (Kd = 54 ± 5 nM) to the intracellular domain of Ifnar2, whereas no binding is observed for USP18-L361F in the same concentration range. Data represent mean ± s.e.m. of two independent experiments.
F Immunoblot of microglia from Usp18+/+ and Usp18-L361F mutant mice demonstrates prolonged Stat1 phosphorylation at defined time points after IFN-β (500 U/ml) exposition. Gapdh is presented as a loading control. Quantification of band intensities is shown next to the blots. One representative data set out of three independent experiments is illustrated.
G Robust microgliosis (Iba-1), presence of amoboid MAC-3+ microglia and accumulation of Isg15 in adult Usp18-L361F mutant but not in Usp18+/+ mice. Quantification of Isg15+ cells in the GM and WM is depicted next to the respective histological images. Five mice per genotype were examined. Scale bars: 200 μm (overview), 10 μm (insert) Each symbol indicates the mean of one mouse. Error bars represent s.e.m. Significant differences are determined by an unpaired t-test and marked with an asterisk (*P < 0.05).

