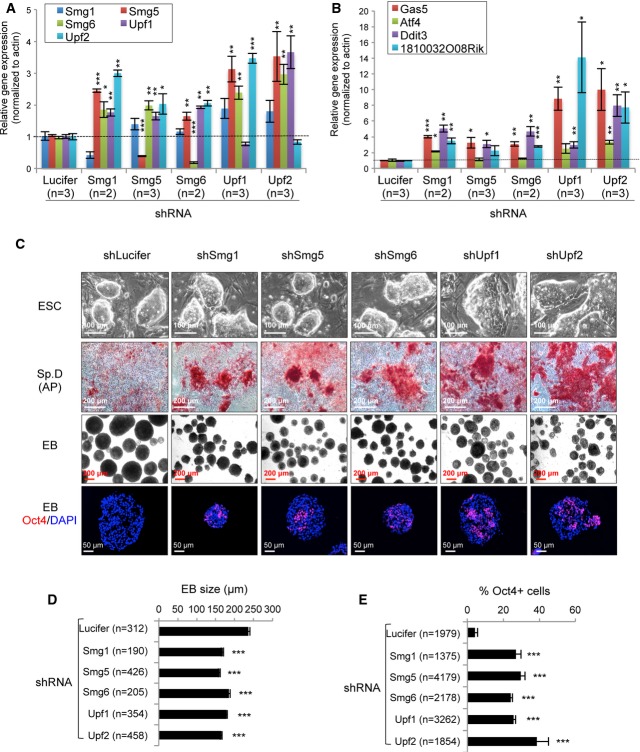
Figure 6. Stable knockdown of the NMD factors in ESCs.
A, B qRT–PCR analysis of expression of NMD factors (A) and NMD target transcripts (B) in stable knockdown ESCs. The expression levels of the NMD factors (A) (Smg1, Smg5, Smg6, Upf1, and Upf2) and NMD target genes (B) (Gas5, Atf4, Ddit3, and 1810032O08Rik) were normalized to β-Actin. The mRNA levels of these genes in control (shLucifer) were defined as “1”. n, the number of independent clones analyzed.
C NMD deficiency compromises ESC differentiation. ESC colonies of control (shLucifer) and NMD-knockdown ESCs growing on feeder and LIF+ medium are shown in the upper panel. Spontaneous differentiation (Sp. D) and embryoid body formation on day 5 (EB) from ESCs after removal of feeders and LIF are shown (middle panels). AP staining was used to detect stem cell identity. Oct4 antibody staining (lower panel) was used to determined the stem cell identify in EBs.
D Quantification of the EB size (C, mid panel). n, the number of EBs for quantification.
E Quantification of the Oct4 expression cells in EBs (C, lower panel). n, the number of cells scored.
Data information: The error bars represent the SEM. *P < 0.05; **P < 0.01; ***P < 0.001. Unpaired Student's t-test was used for the statistical analysis.

