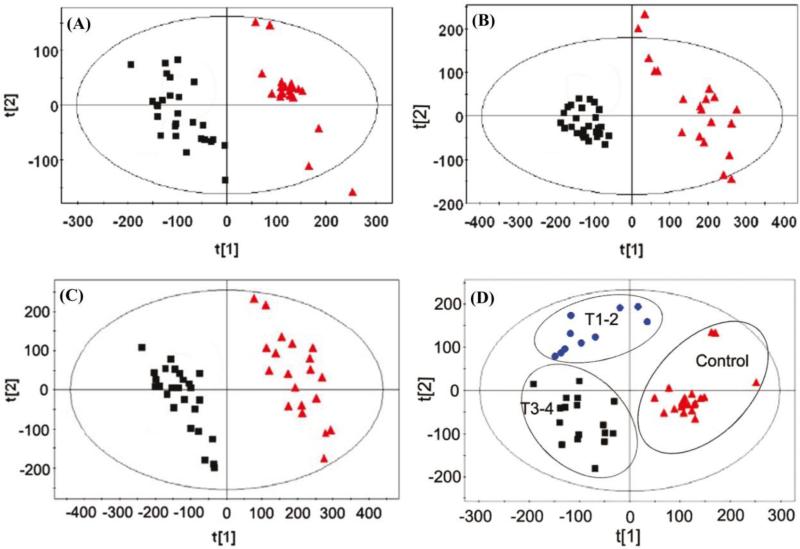
Fig. 10.
Score plot based on (A) RPLC data, (B) HILIC data, and (C) combined data sets (■ renal cell carcinoma patients, ▲ control patients). (D) Staging of patient renal cell carcinoma from combined RPLC/HILLIC-MS data. (▲control patients, ● T1-T2 stage, ■ T3-4 stage). Figure obtained/modified from reference [82]. Permission pending.

