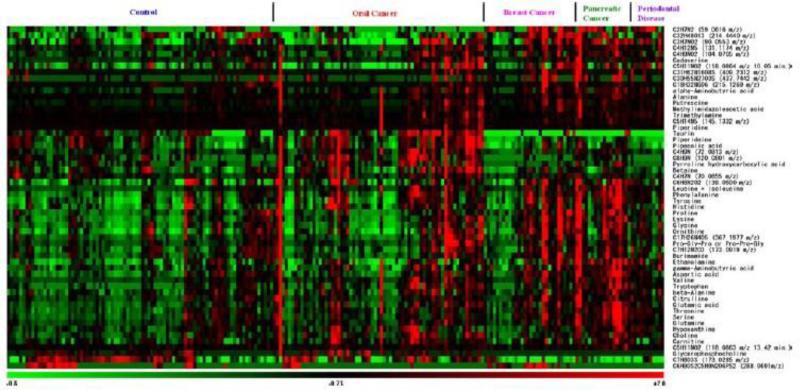
Fig. 12.
Heat-map of 57 tentative biomarker candidate peaks from 215 patients (control = 85, disease = 128) saliva samples. Columns represent individual patient and rows specific metabolite. Figure obtained/modified from reference [83]. Permission pending.

