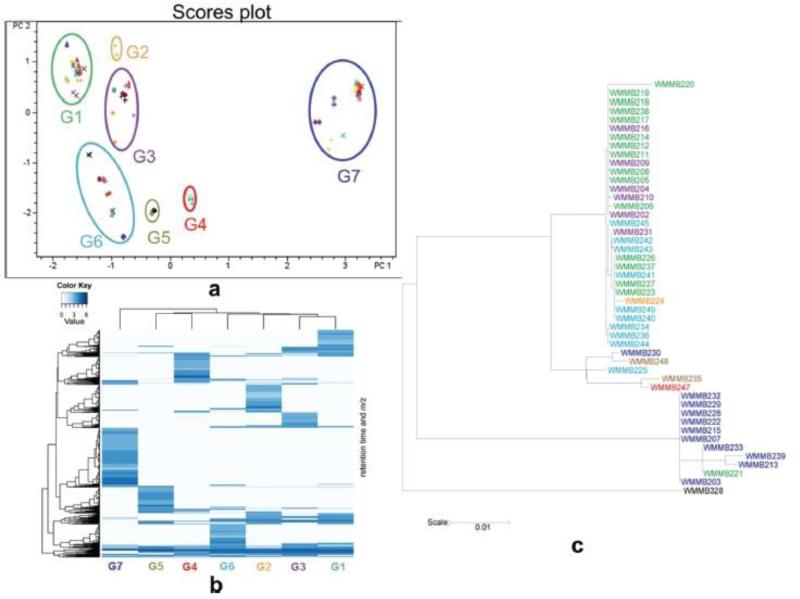
Fig. 13.
Isolate de-replication by metabolomic analysis. (a) LC-MS-PCA score plot of 47 strains. (b) Heat-map illustrating metabolic profiles of clusters from PCA, groups 1-7. (c) Phylogenetic tree of strains, colors correspond to metabolomic profiles. Streptomyces sp. (WMMB-328) used as an outgroup. Figure obtained/modified from reference [95]. Permission pending.

