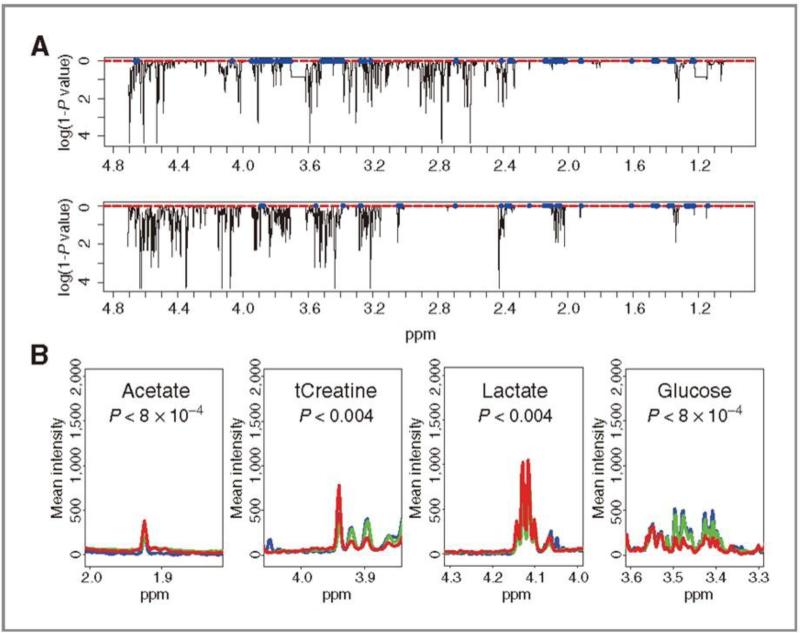
Fig. 3.
A: the Wilkoxon rank sum tests of 7-day LMC group (top) and 3-day LC group (bottom) were performed. The x and y axes represent the ppm axis, and the log of 1-P values, respectively. Values with. P values smaller than 0.01 are shown as blue dots. B: Marker metabolites profile for the LMC group. The actual levels of the LC marker metabolites are exhibited with corresponding peaks. Blue-normal; green- 3-day LMC; red-7-day LMC. Figure obtained from reference [42]. Permission pending.

