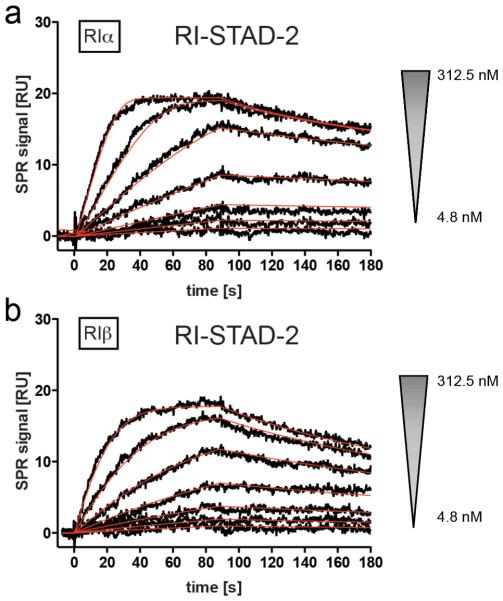
Figure 4.
Binding analysis to human PKA type I R-subunits. Interaction of RI-STAD-2 with RIα and RIβ (for rate and equilibrium binding constants, see Table 1). (a, b) RIα (800 RU) or RIβ (800 RU) subunits were captured on 8-AHA-cAMP sensor chips, and RI-STAD-2 was injected at the concentrations indicated. Black curves represent the measured responses, whereas red lines reflect the applied global fit using the 1:1 Langmuir interaction model. Association and dissociation phases were monitored for 180 s. RU, response units.

