Figure 4.


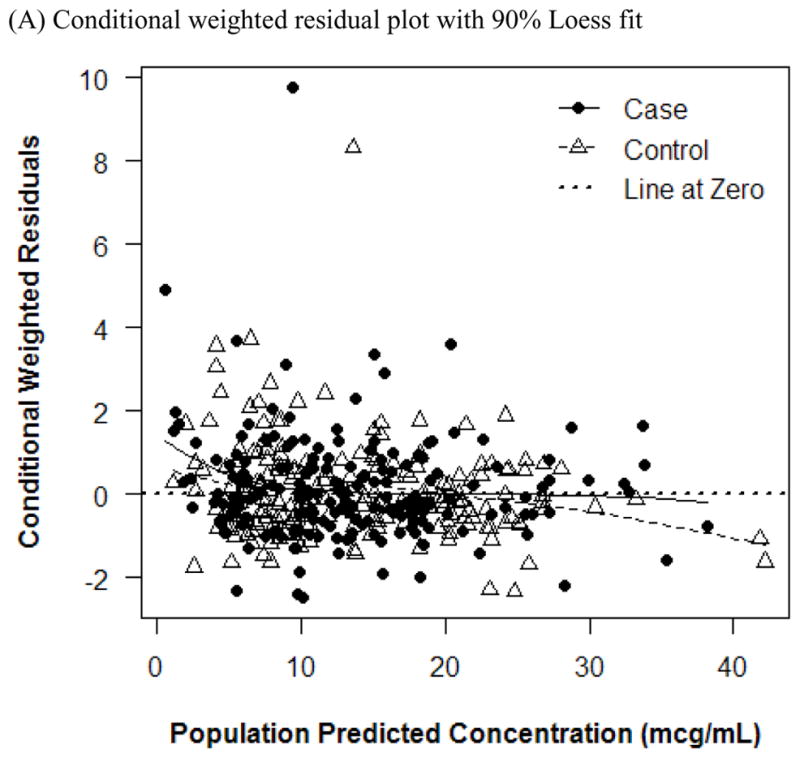
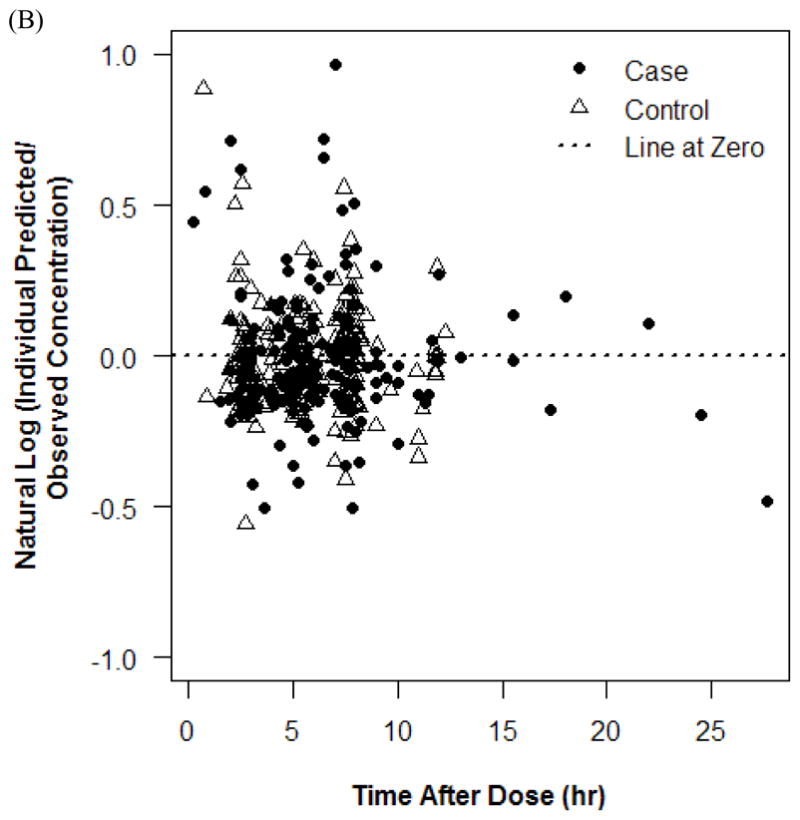
Plots of residuals in concentrations. Conditional weighted residual plot with 90% Loess fit (A) and natural log plot (B).


Plots of residuals in concentrations. Conditional weighted residual plot with 90% Loess fit (A) and natural log plot (B).