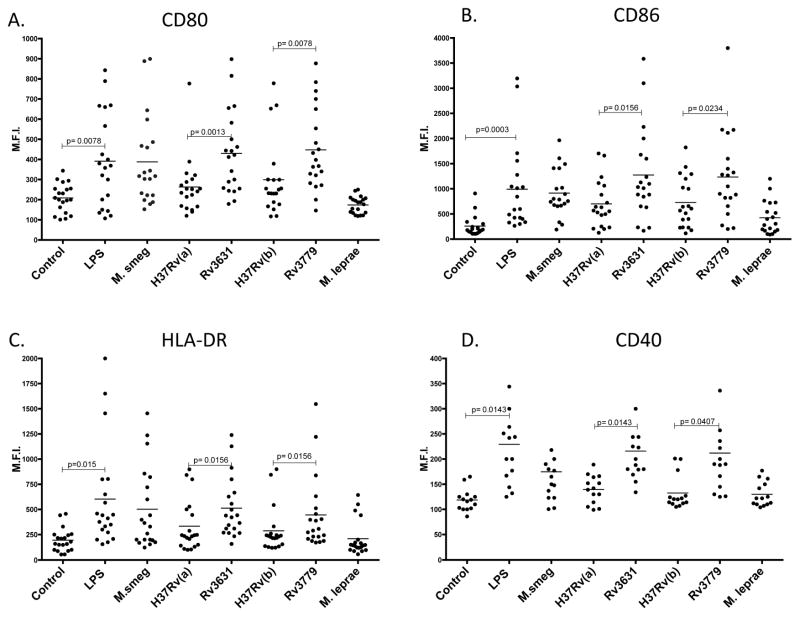
Figure 2. The GalN-deficient Rv3631 and Rv3779 knock-out mutants consistently stimulate better expression and translocation of the common DC maturation markers, CD80, CD86, CD40 and HLA-DR when compared to their GalN-proficient WT parents.
hPBM-DCs were treated and analyzed as in Figure 1. Whole blood was obtained from 20 individuals and hPBM-DCs were prepared and treated with LPS (25 ng/ml), M. smegmatis (M.smeg), WT H37Rv(a), H37Rv(a)ΔRv3631, WT H37Rv(b), H37Rv(b)ΔRv3779 or M. leprae. The figure shows the cumulative results for mean fluorescence intensity values for the human cohort. CD40 plots were limited to 14 donors because this analysis was initiated later in the project. Statistical power is, however, maintained using this lower number of donors. P values were obtained using a paired one-tailed t test that determines the significance between pairwise values among treatment groups (see Material and Methods Statistical section). The horizontal bars represent the mean value measured for each treatment regimen.

