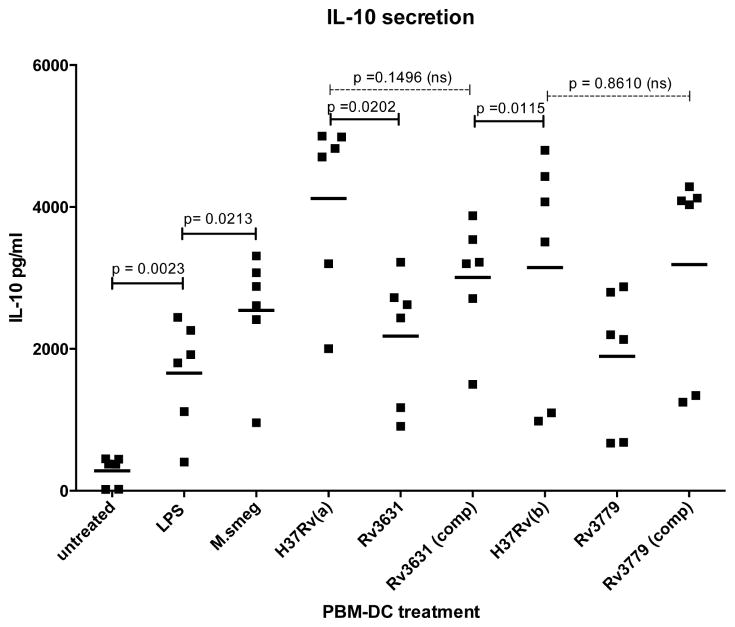
Figure 4. hPBM-DCs from six donors treated with Mtb mutant strains deficient in the galactosaminylation of AG fail to produce IL-10 to the level of the WT parent strains.
DCs were treated as in Figure 1 and supernatants were analyzed for cytokines. The samples were read using a FACsCanto II flow cytometer by using the BD Biosciences CBA software. Cytokine levels in each sample were calculated per company protocol by extrapolating the mean fluorescence intensity for each sample into the standard curves for every cytokine. X-axis labels and p value calculations are the same as in Figures 1–3. A p value of ≤0.05 is considered significant (comparative values above solid spanning lines. Thus the differences between respective WT and mutant IL-10 secretion is considered significant whereas the differences were not significant in the comparison of the WT with their respective complemented mutants (comparative values above the dashed spanning lines). The horizontal bars represent the mean value of the 6 donors measured for each treatment regimen.

