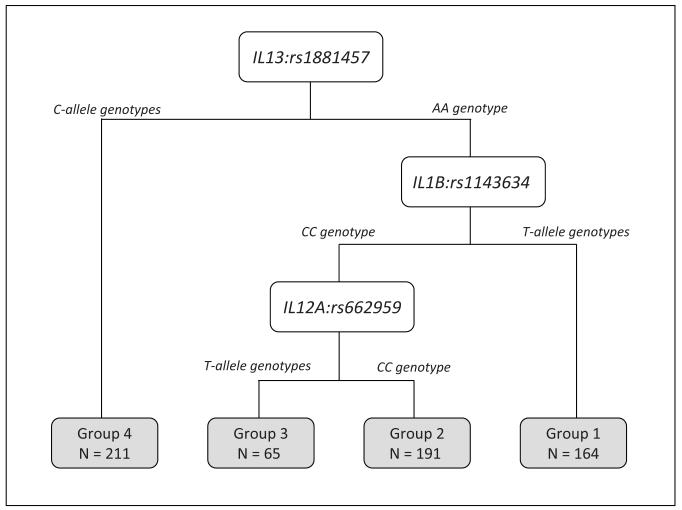
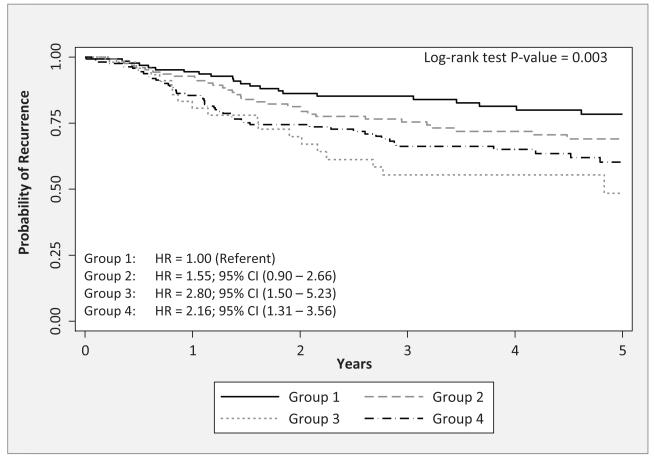
Figure 1.
A) The tree structure of the classification and regression tree (CART) analysis for time-to-recurrence of the six IL SNPs from Table 3. The CART analysis identified 4 subgroups based on three of the six SNPs: IL13:rs1881457, IL1B:rs1143634, and IL12A:rs662959. B) The Kaplan-Meier survival curves and overall log-rank test for the subgroups identified by the CART analysis. Hazard ratios (HRs) and 95% confidence intervals (CIs) were calculated for each subgroup using group 1 as the referent subgroup (HR = 1.00).


