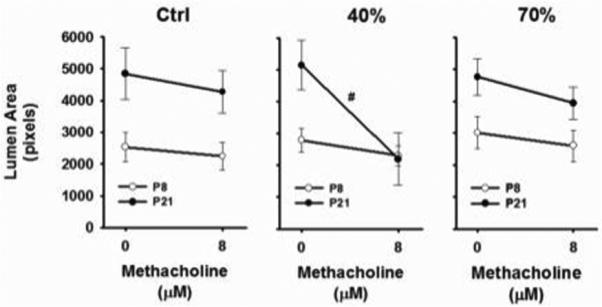
Figure 3.

Comparison of airway responses to methacholine (8 μM) between P8 and P21 mice for each treatment group. Note the magnitude of the response to methacholine (no differences between slopes, left panel) was similar between P8 and P21 control mice, whereas airway reactivity was significantly higher at P21 (steeper slope, middle panel) compared to P8 following 40% O2 exposure. 70% O2 exposure had similar effects on P8 and P21 airway reactivity (right panel). #significant difference in the slope compared to P8 mice (p<0.05) [m±SEM; 1 μm=0.39 pixels].
