Figure 5.

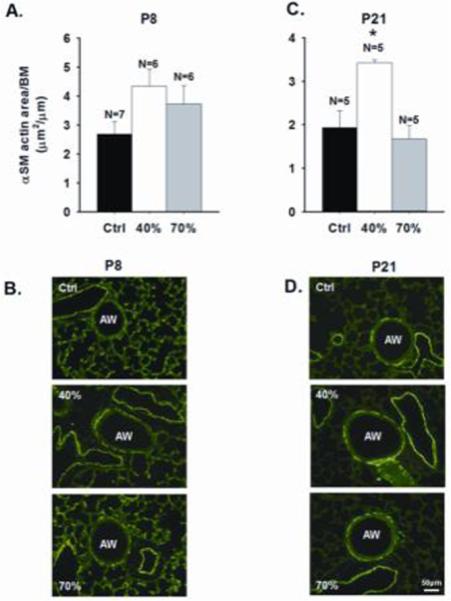
Immunohistochemical quantification of α smooth muscle (SM) actin in P8 and P21 mice following neonatal hyperoxia exposure. The α SM actin area expressed per airway (AW) basement membrane (BM) was similar between treatment groups at P8 [A], whereas at P21, it was increased by 40%, but not 70% oxygen [C]. Representative images are shown in [B] and [D]. *significant difference from control and 70% exposed mice (p<0.05) [m±SEM] [scale bar=50 μm].
