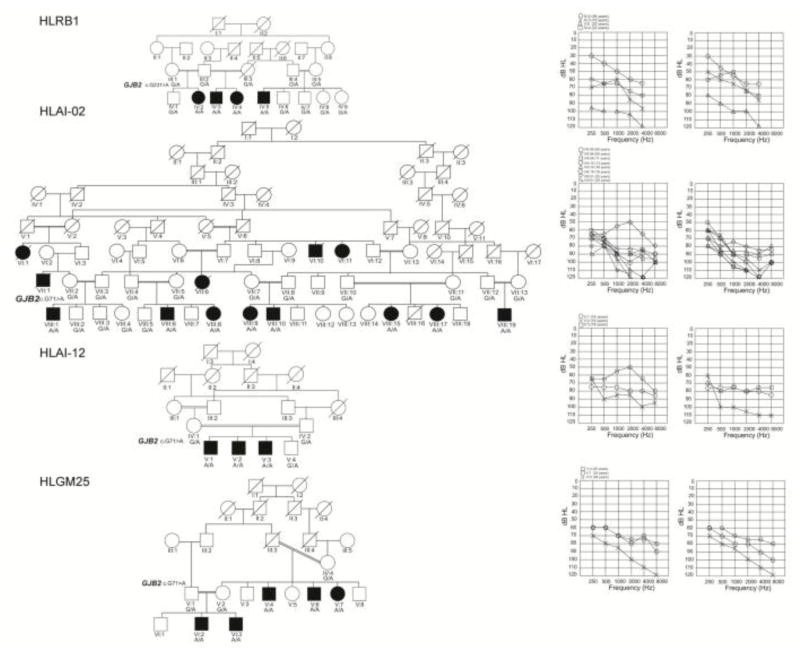
Figure 1. Pedigrees of four families in which the affected individuals exhibit intrafamilial differences in hearing thresholds.
Black circle’s and squares represent affected female and male participants, respectively. The double horizontal lines denote consanguineous marriages. The genotype for the mutation in GJB2 is provided below each symbol representing the participant. The audiograms on the right side of each pedigree represent the hearing thresholds of the left and the right ears of the affected individuals, respectively.

