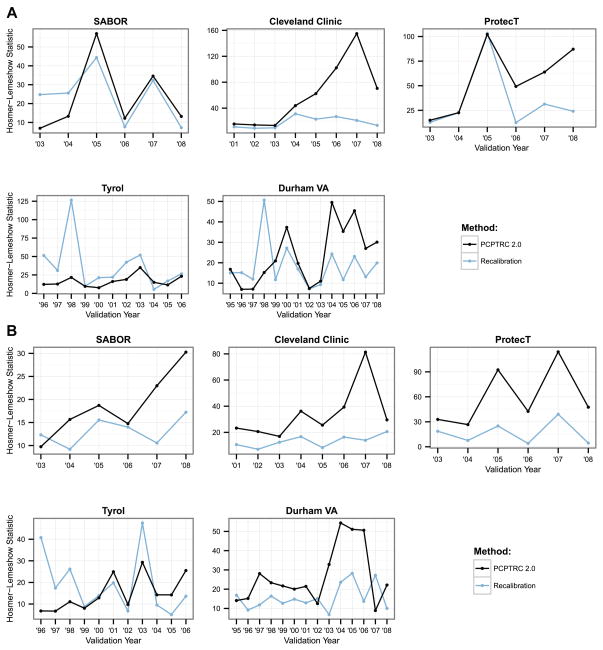
Figure 3.
Hosmer-Lemeshow test statistics using all past data as training and the next year as the validation year (x-axis) for predicting a.) high-grade versus low-grade or no cancer, and b.) overall (high- and low-grade cancer) versus no cancer. Lower values indicate better fit, closer agreement between observed and predicted risks.

