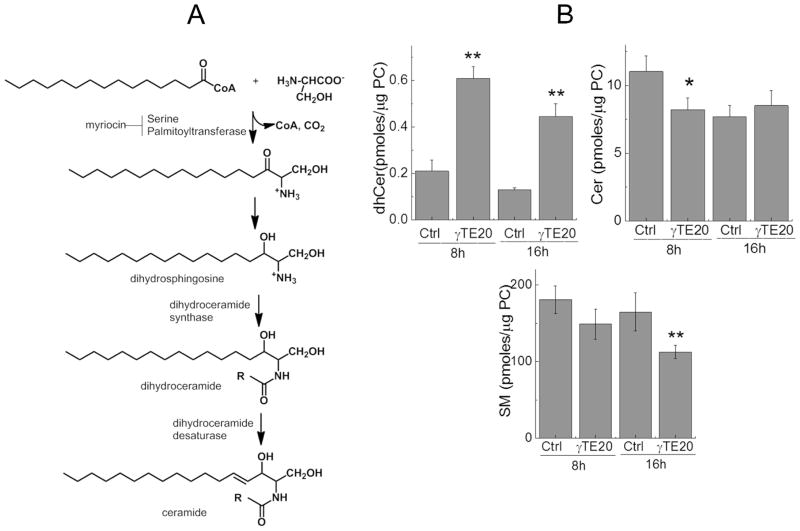
Figure 5. γTE modulated sphingolipid metabolism.
Panel A: De novo synthesis of sphingolipids. R = Acyl group with C16 - C26. Panel B: RAW 264.7 cells were treated with γTE at 20 μM for 8 or 16 h. Sphingolipids including total dihydroceramides (dhCers), ceramides (Cers) and sphingomyelins (SMs) were analyzed by LC-MS/MS and expressed as Mean ± SD (n = 4 or 5). *P < 0.05 indicates significant difference between control and γTE treated cells.

